Introduction
With the rise in data and analytics, a lot of effort has gone into predicting football matches and season outcomes. Anyone who has spent time in this space has seen the predicted table by Opta's supercomputer. I am writing this post a couple of days after Manchester City beat Arsenal 2-1. The morale of Arsenal fans is at an all-time low, after a disastrous April so far. However, Opta's supercomputer still gives Arsenal a 71% chance of winning the Premier League. Depending on which fan you ask, that number is either reassuring or absurd.
Opta's supercomputer is a serious piece of modelling, and we're not trying to replicate it. What we are going to do is something simpler. We are building a version of the current table that reflects each team's trajectory, where the model thinks a team belongs right now, given both the results they've earned and where their form looks to be heading. We call it the adjusted table, a view of the league that asks, if everything we know about these teams held steady, where should they really sit at this point in the season?
What are the most important factors in predicting football results?
To answer this question, we collected data from the top 5 European leagues from the 2014/15 season through the present one. We have the standings from each match week for every one of these seasons, along with high level statistics for each of the games. For each matchweek, we trained a linear regression model to predict how many more points a team would earn from that point going forward. Since simplicity is fundamental to our exercise here, we restricted ourselves to only four features: cumulative expected goal difference, average possession, points earned, and team strength. We used an Elo based system to calculate team strength, the same system used in chess. After each match, teams gain or lose rating points based on the result and the strength of their opponent. Beating a strong team earns you more than beating a weak one. Because Elo updates gradually and carries history from previous seasons, it's a slow-moving, long-memory measure of a team's quality.
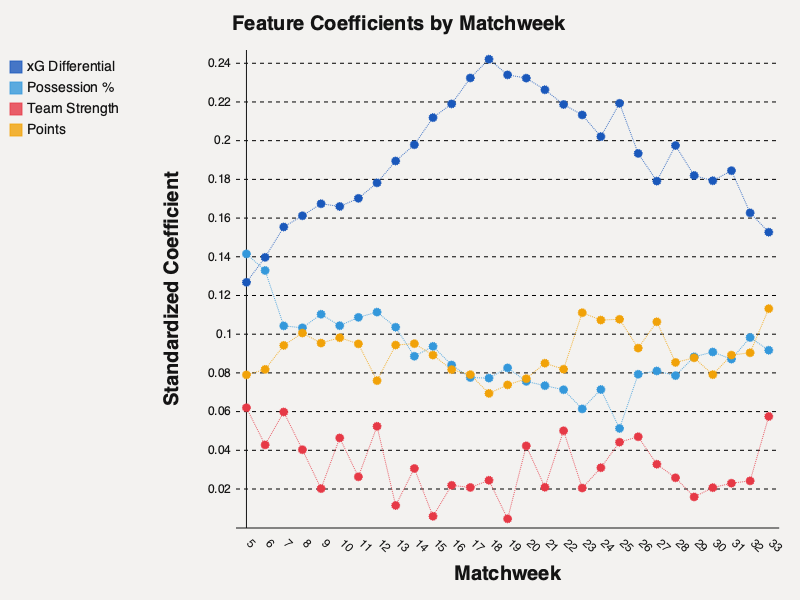
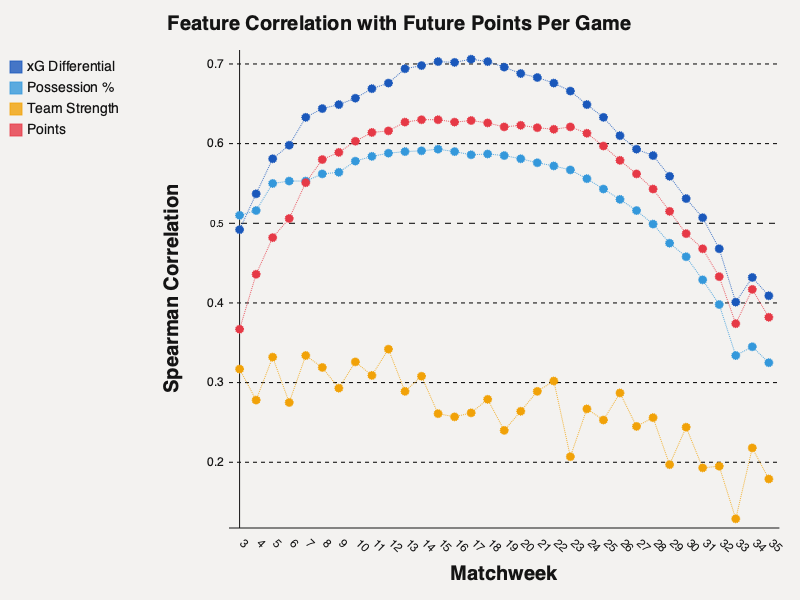
Our headline finding is that expected goal difference (xG − xG against) is the king of all predictive features for a majority of the matchweeks. Early on in the season, we see average possession have a slightly higher influence, likely because the xG numbers are still settling in. But after Matchweek 5, we see the influence of expected goal difference grow significantly. More importantly, it's a better predictor of future points than the points a team has actually earned. The scoreboard lags. Points reflect what has happened; xG differential reflects how a team is actually playing. When it comes to what happens next, how they've played matters more than the points already on the board.
Team strength is surprisingly the least predictive. That can be explained by the fact that Elo is a slow moving feature, and the xG differential picks up on upticks in form and sustained increases in strength faster than Elo can.
We also notice that the predictive power of these features drops towards the end of the season. With very few games remaining, points-per-game becomes a much noisier quantity. A single fluke result can swing a team's average dramatically, and no feature, however good, can track that noise.
What does our adjusted table look like?
To construct the adjusted table, we take the model's projected final points total for each team and scale it back to the matches they've played so far. Concretely, if the model thinks a team finishes on 76 points, and they've played 33 of 38 games, their adjusted total is 76 × (33/38) ≈ 66. It's a way of expressing the model's forecast as a current-table equivalent, so it can be compared against the actual standings on a like-for-like basis. Another way of thinking about our adjusted table is: if all the teams picked up points at a steady rate (taking into account the games already played, and our predictions for the rest of the season), what would the standings look like right now?
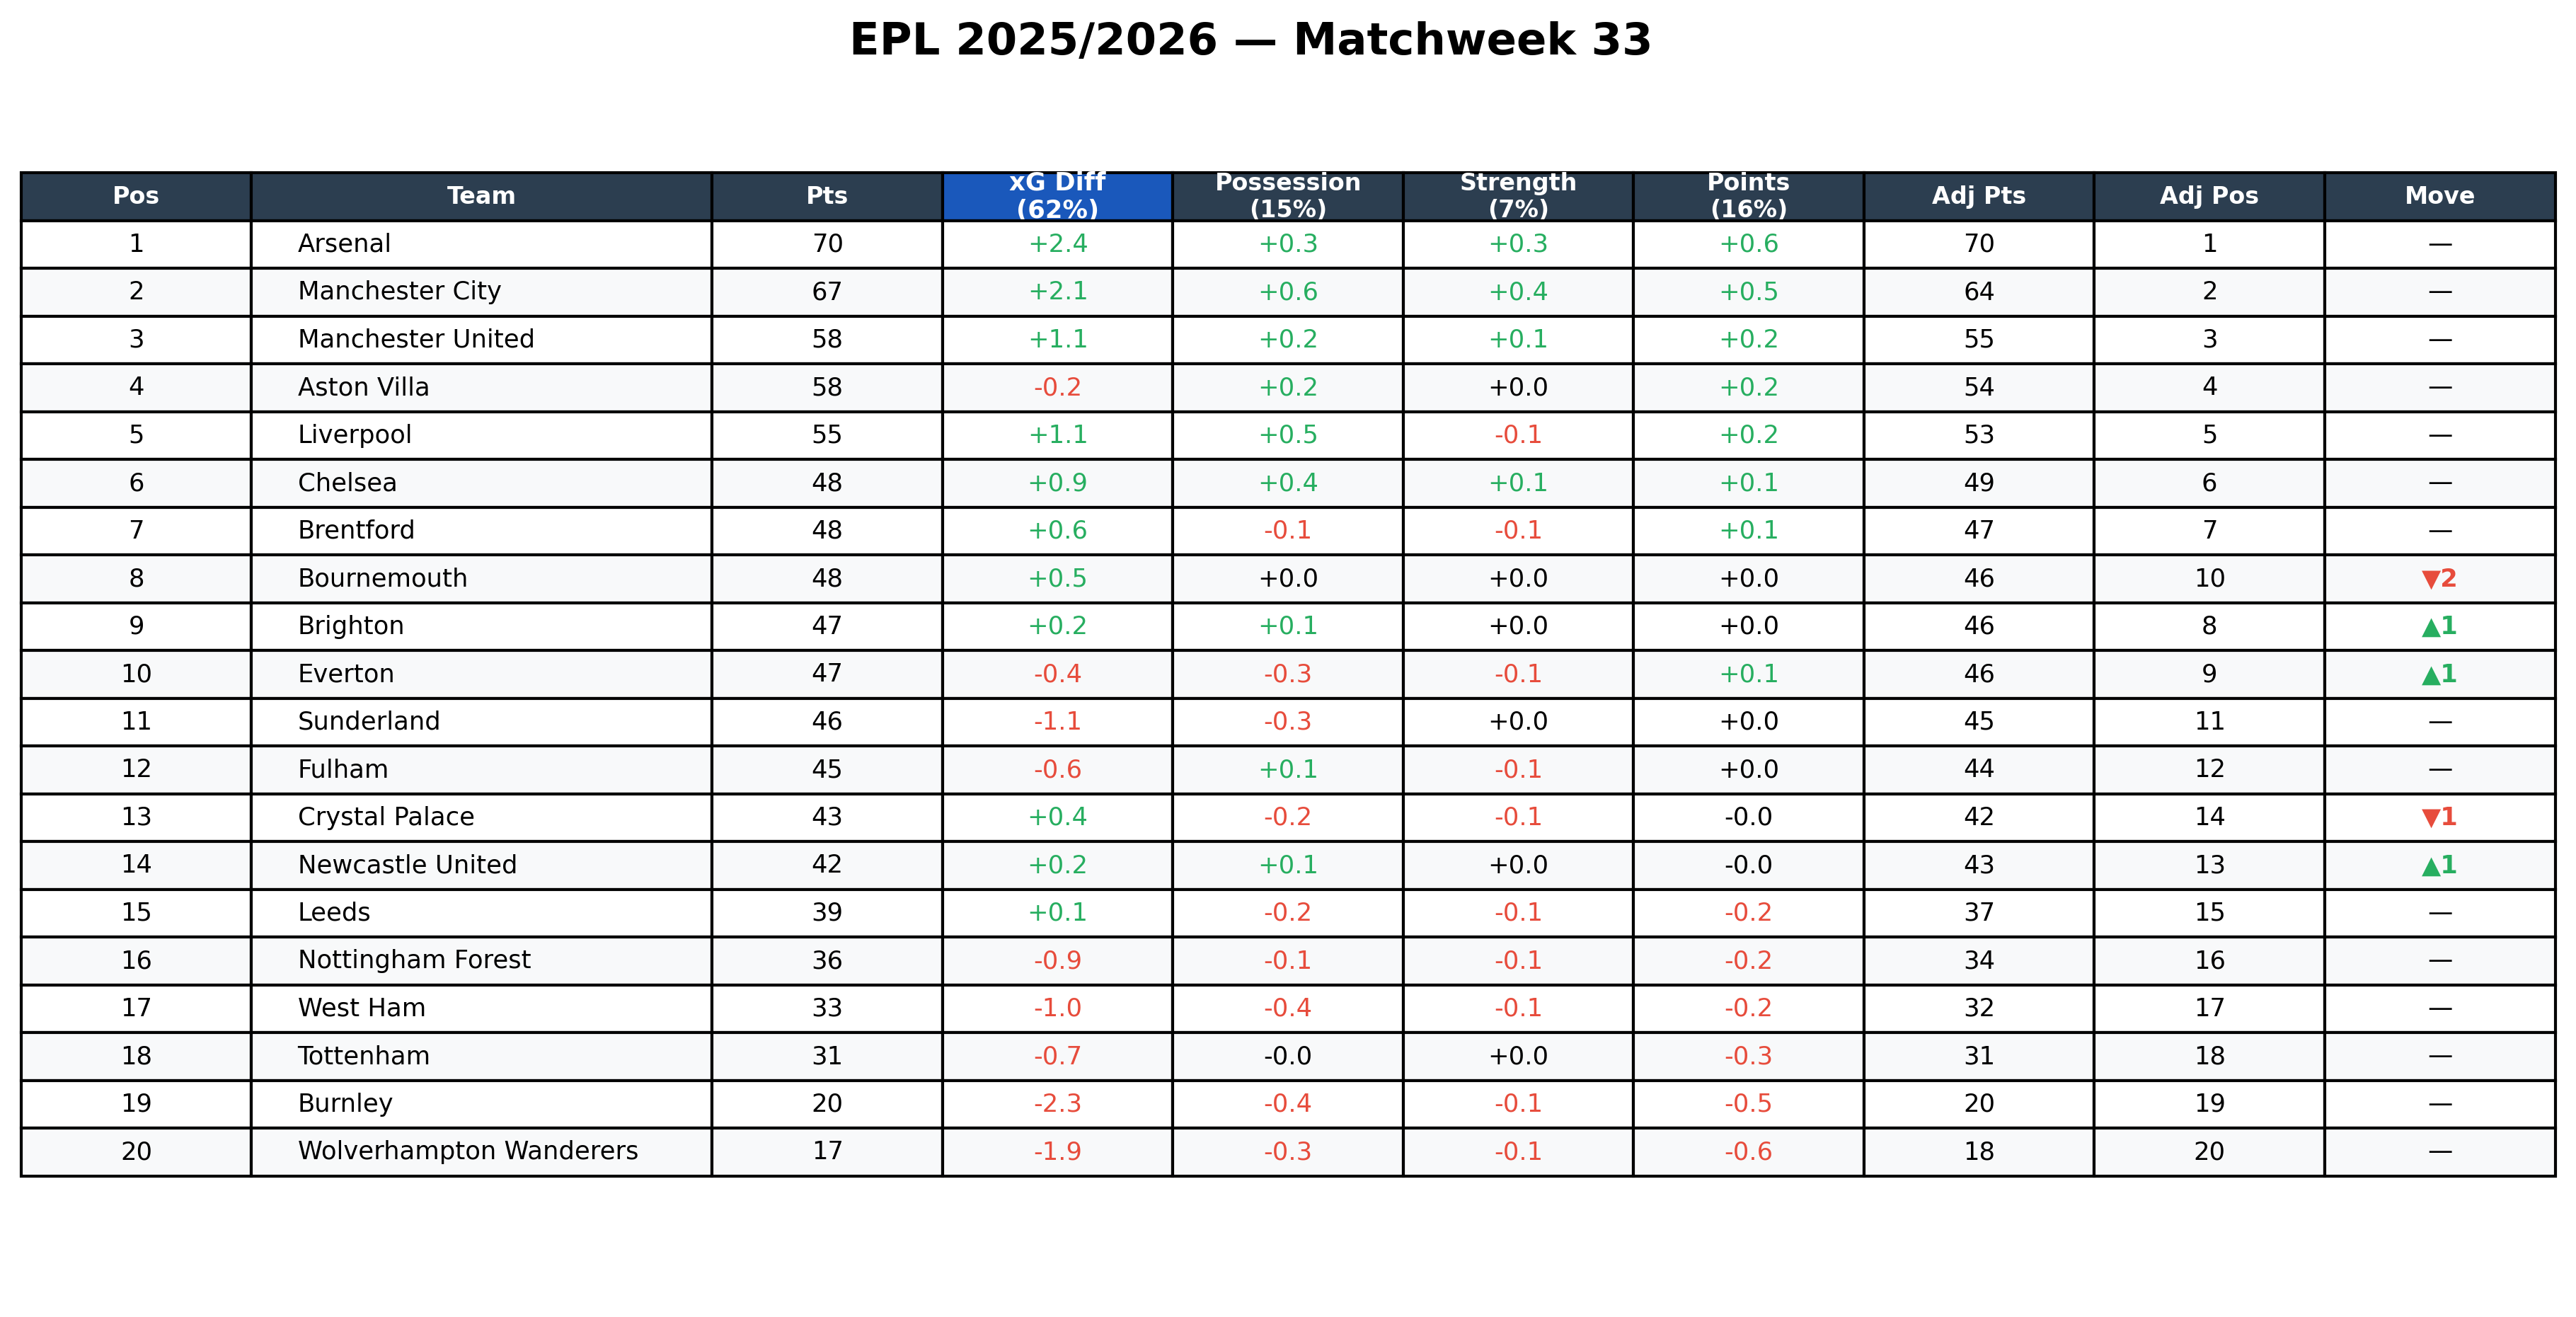
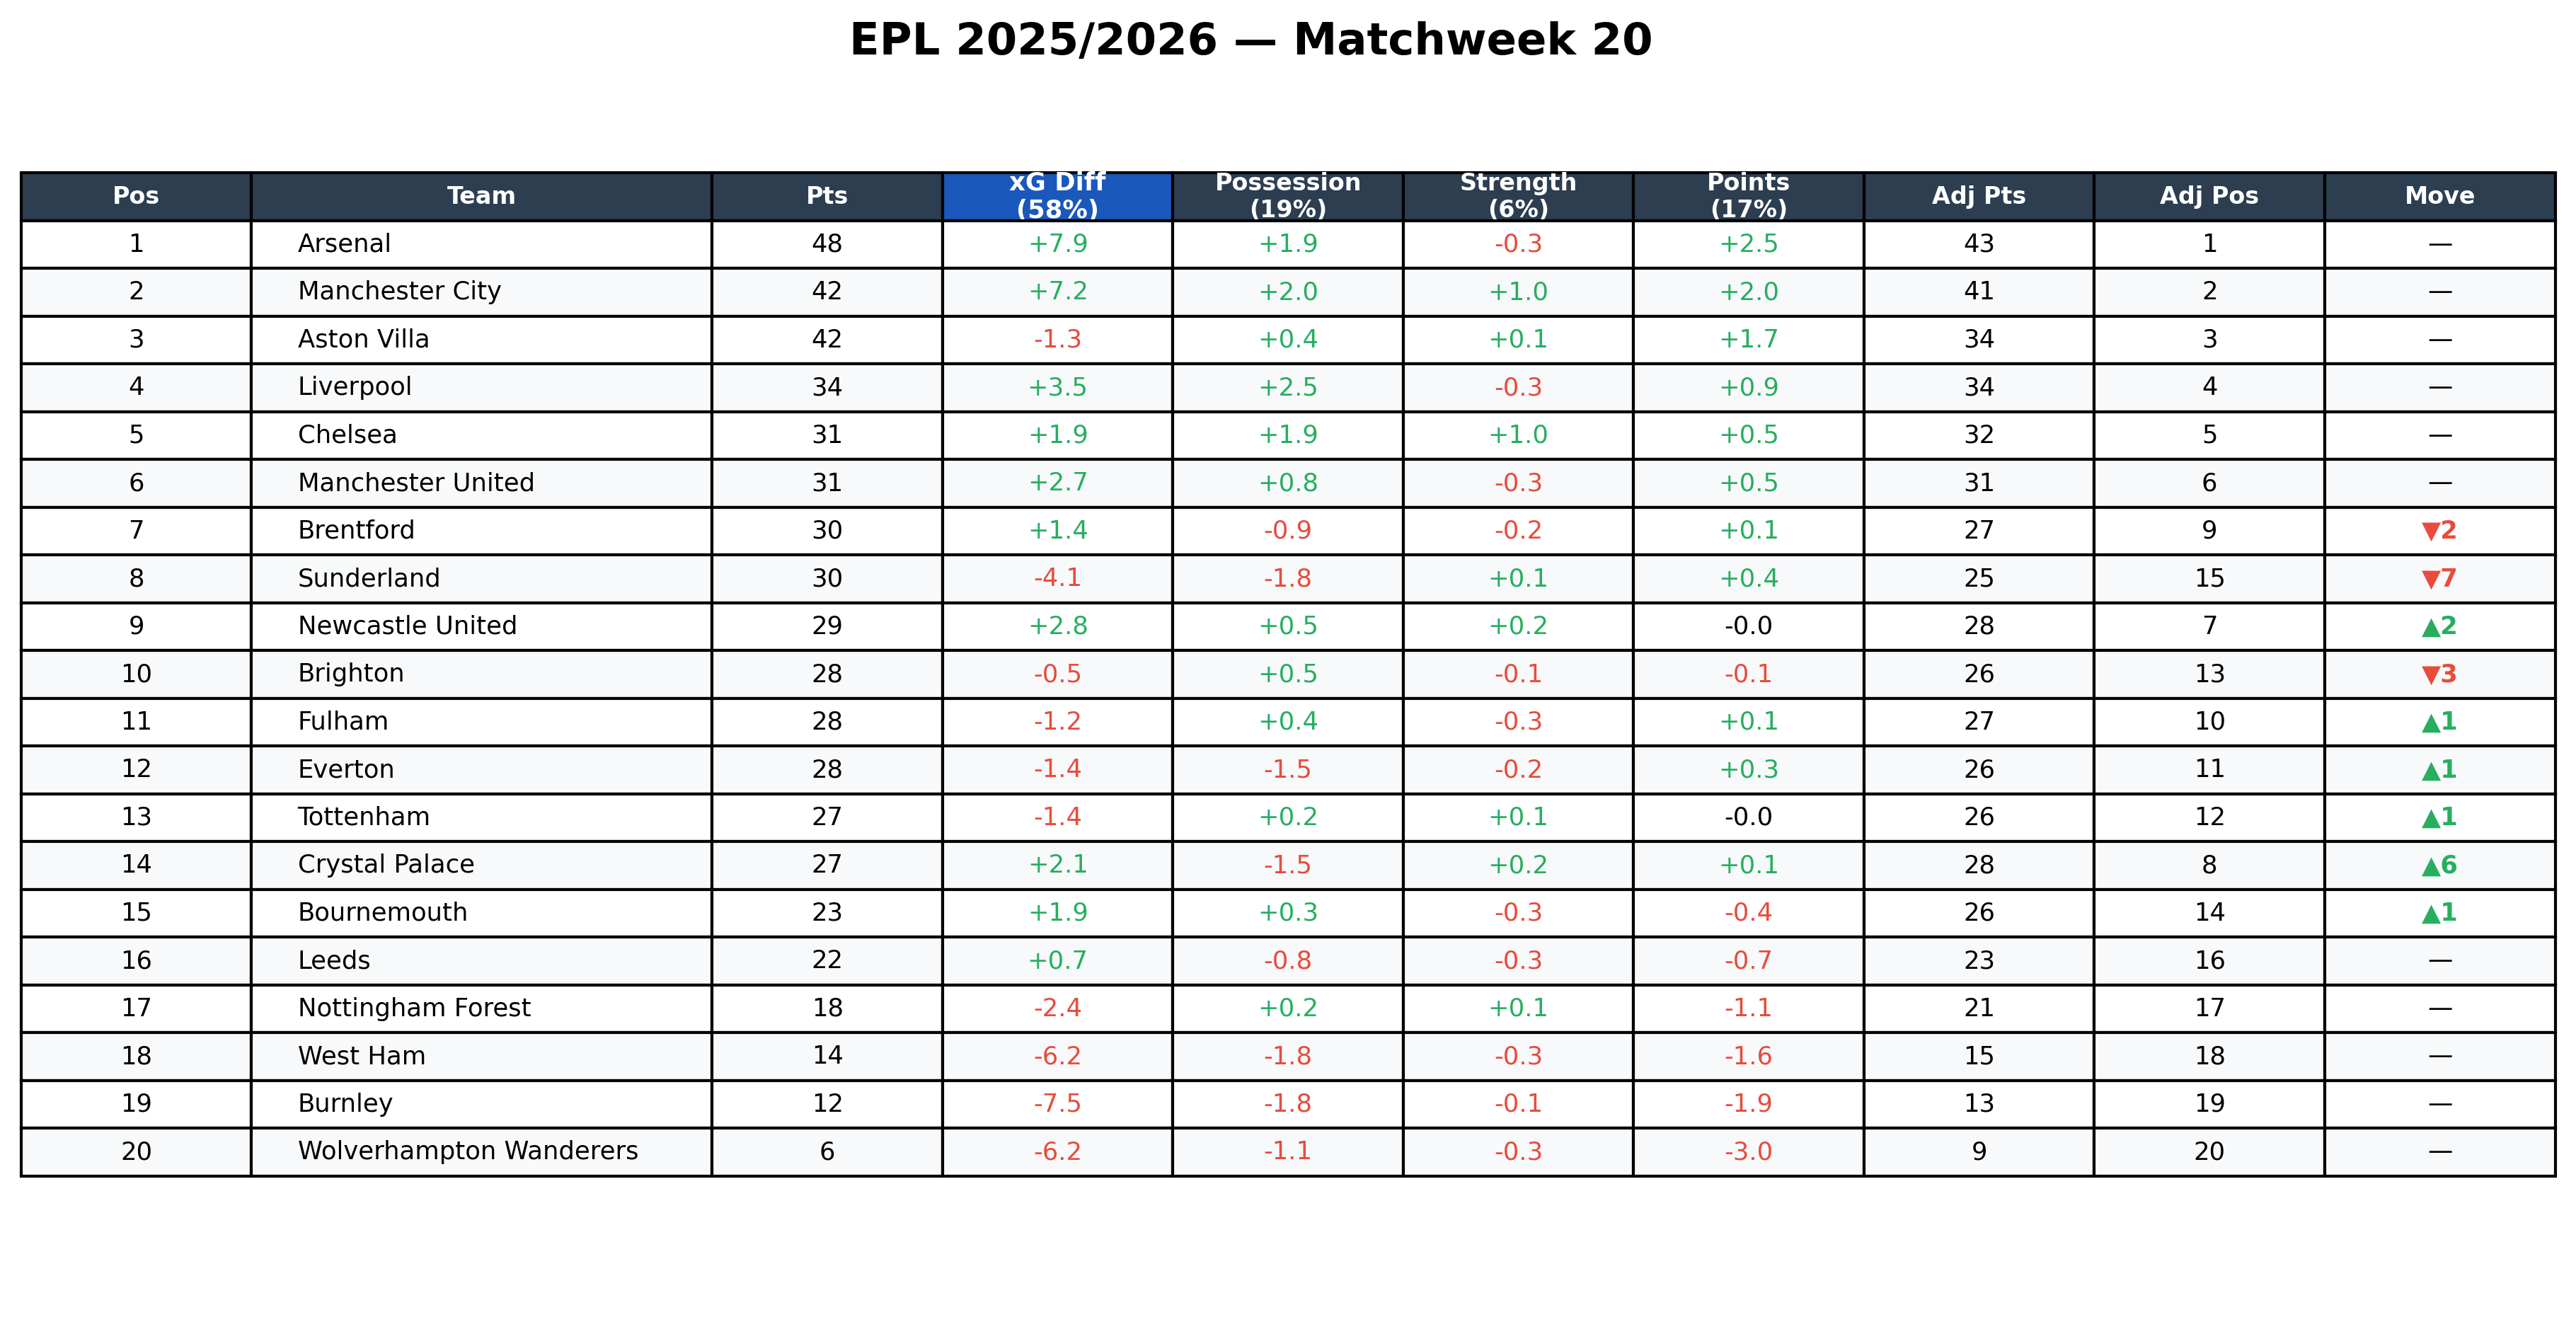
A quick note on reading the table. The percentage in each feature's column header shows how much that feature contributes to the model's forecast of future points at this matchweek. At MW33, expected goal difference alone accounts for 62% of the signal. The numbers in each row show how many points above or below an average team that feature is expected to earn over the remaining games. At MW33, with five games to play, Arsenal's +2.4 under xG differential means their superior xG is expected to earn them about 2.4 more points than an average team's xG would over those five games. The Adj Pts column then adds the model's forecast to the team's current points and scales it back to the games played so far, so it can be read alongside the actual Pts column. Adj Pos is the resulting league position, and Move is how far that position differs from where the team sits on the real table today.
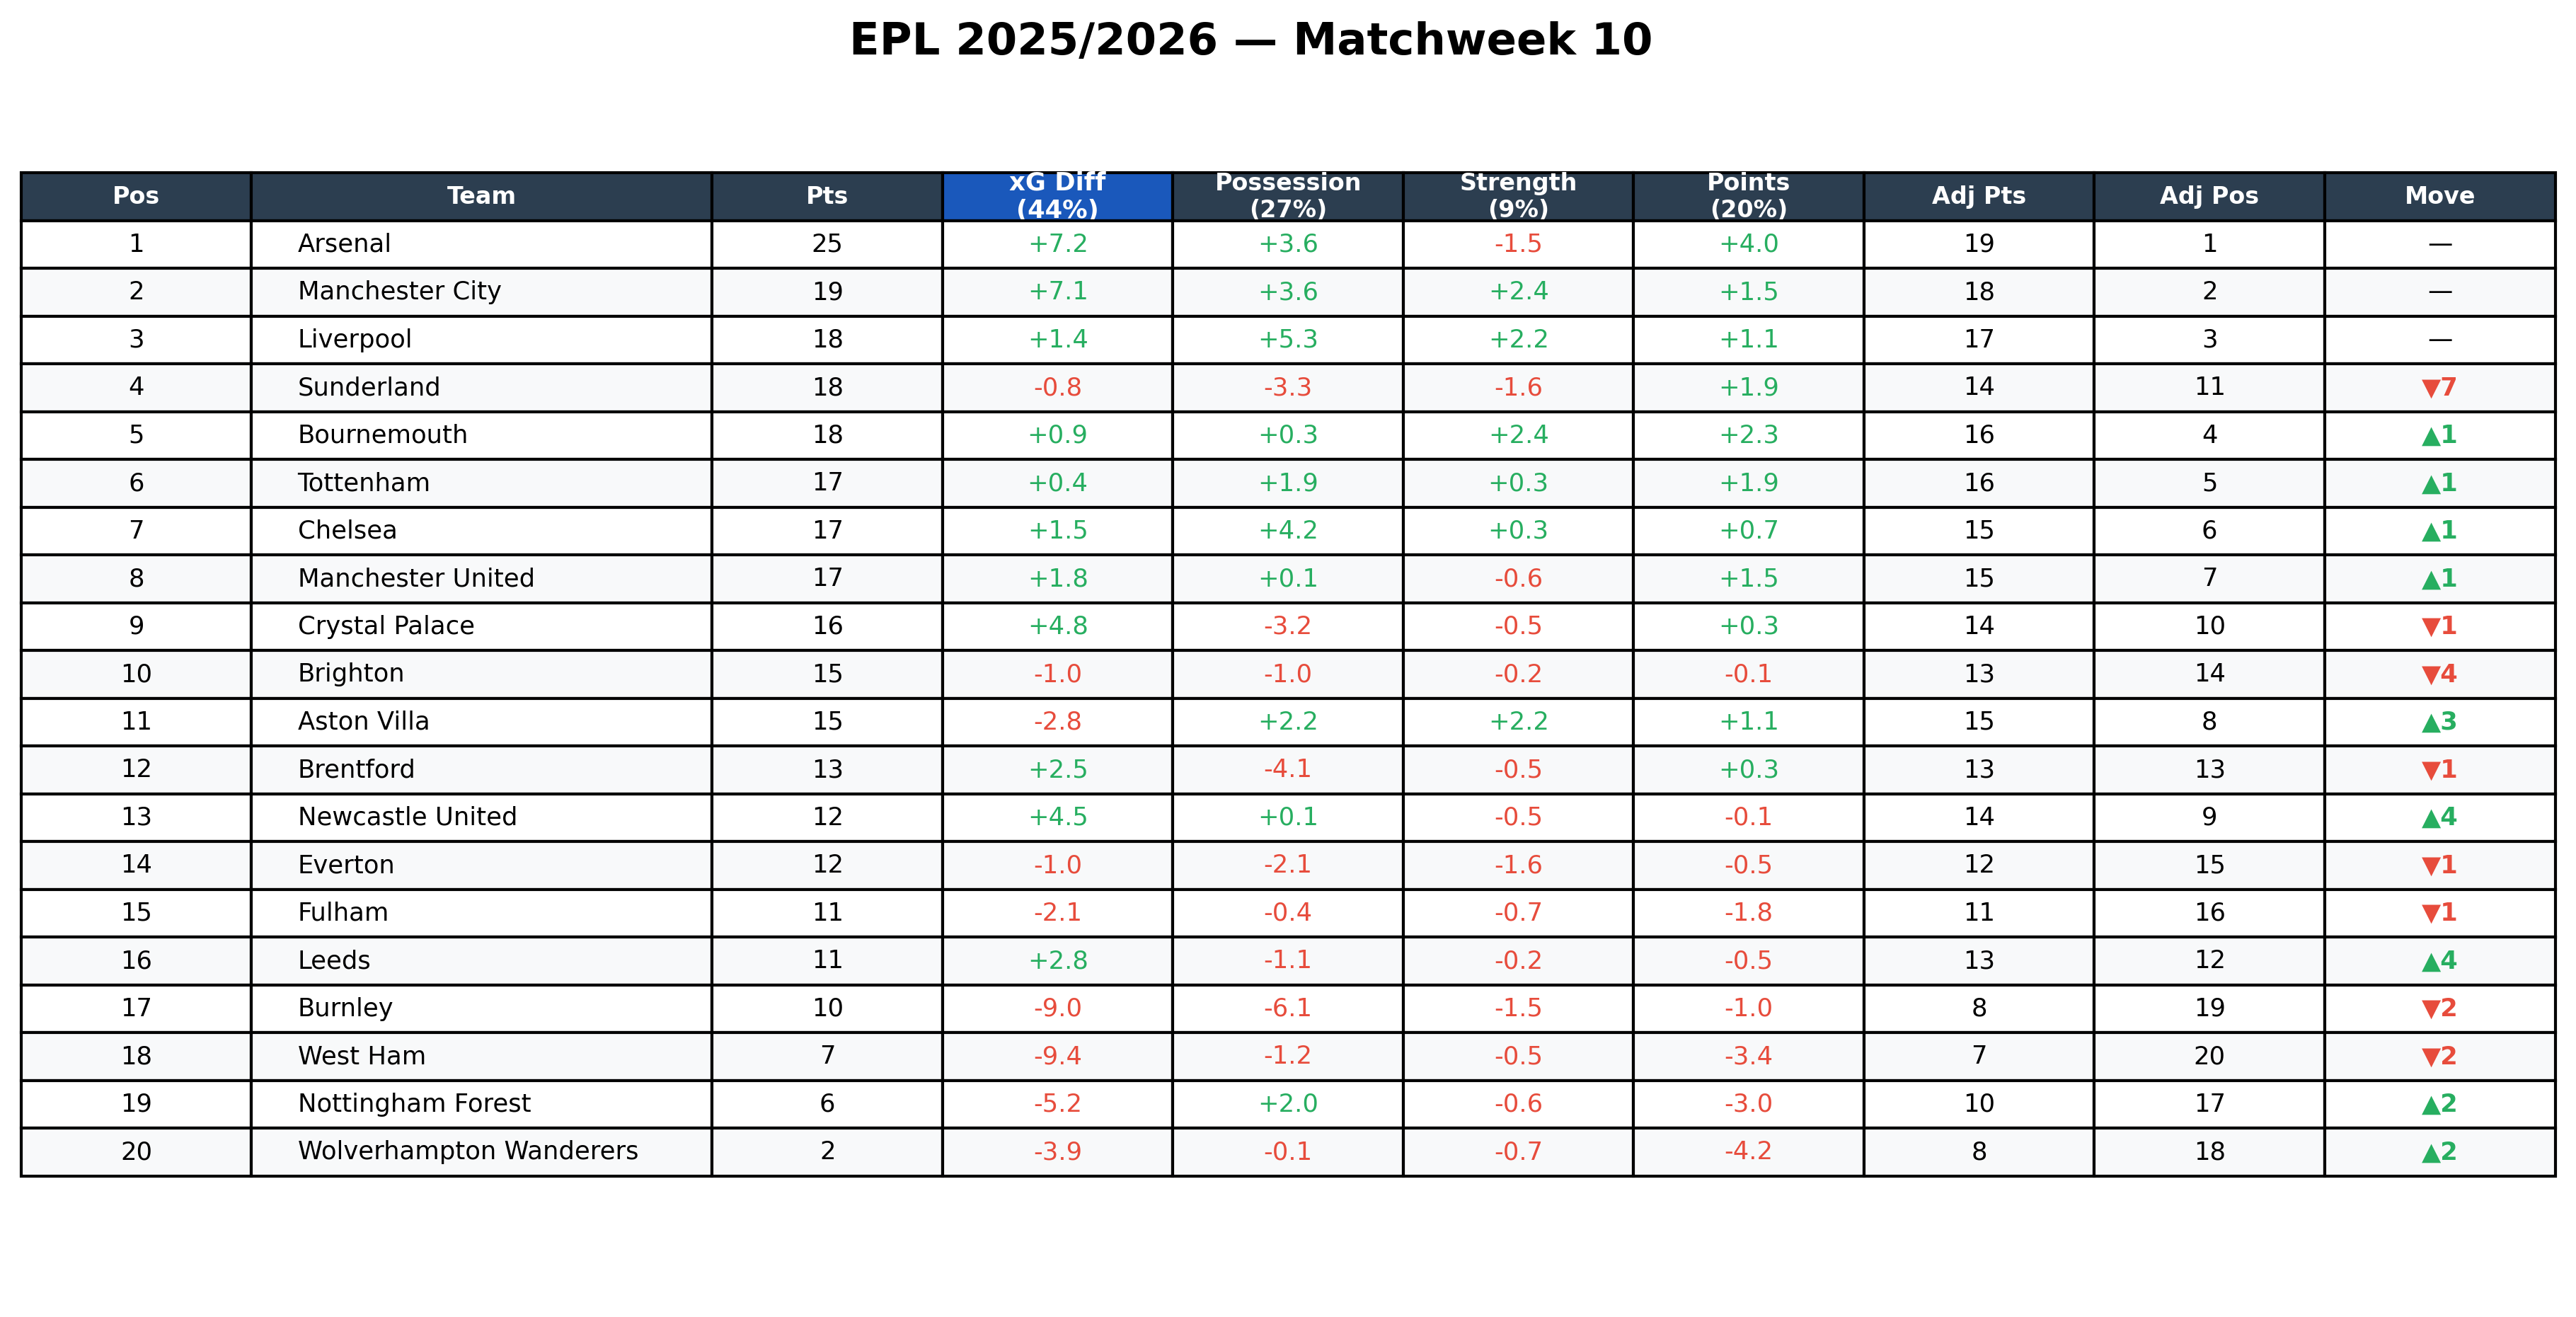
At matchweek 33, the adjusted table looks almost identical to the real one. Arsenal are still top, Wolves are still gone. But at earlier points in the season, when results have had less time to converge with performances, it tells a very different story. Let's look at how the model evolved over the course of the season by examining the adjusted table at matchweeks 10 and 20.
What does the adjusted table get right?
- By matchweek 10, we have the title contenders, and four of the relegation contenders locked in. The only relegation contender that the model is missing is Spurs.
- The adjusted table correctly placed Sunderland outside the top half from matchweek 10 onward, despite their strong start on the real table.
- The adjusted table's trajectory for Spurs never showed a surge up the table, even as squad-pedigree narratives might have suggested one was due.
What did the adjusted table miss?
- The adjusted table placed Bournemouth in the Champions League spots at matchweek 10, which was a bit too optimistic.
- Newcastle were consistently expected to see an uptick in form, which never happened (at least not to this point by the time of writing).
Both misses share a pattern: the model was slow to walk back early-season impressions, even as the results on the pitch piled up against them.
Conclusion
So, how predictable is the league table? More than a casual fan might expect, and less than a supercomputer might imply. With just four features, we can go a long way and get to a very reasonable-looking adjusted table. However, the headline finding is that once the season is in full swing, expected goal difference does a lot of the heavy lifting. It picks up on underlying quality faster than Elo, and holds its edge through most of the season.
The model will be wrong about something between now and May. Newcastle's uptick never came, Bournemouth didn't hold their pace, and there will be more misses over the final five matchweeks. But it's been close enough, often enough, to be worth looking at, and every prediction it makes is one you can trace back to four numbers on a spreadsheet.
As for Arsenal, the adjusted table has them first, and so does Opta's supercomputer. The question was never really whether they're the best team in the league. It's whether two bad weeks should change your mind about that — and on the numbers, not really.